Comparason of movie directors
Movie investors always want to do best investment that can end up most return. The director is one of most significant factor to achieve this goal. Therefore it worth to predict profit given a certain amount of budget based on their historical records.
At this time, I only analyze four famous science fiction directors: James Cameron, Steven Spielberg, Quentin Tarantino and Francis Ford coppola.


Results
Ratio of box office and budget
- From this ratio figure, if budget is less than $100 million Steven is the best; whereas if budget is larger than $100 million James is outstanding.
Ratio of box office and budget
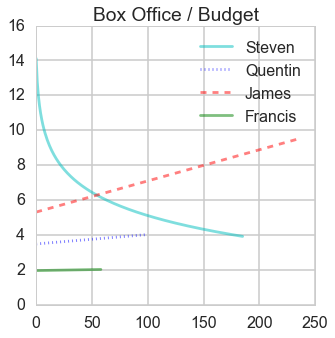
- From this ratio figure, if budget is less than $55 million Steven is the best; whereas if budget is larger than $55 million James is outstanding.
Takeaway points
- Be careful with the outliers, rule them out before apply regression.
- Find the right function to fit the data.
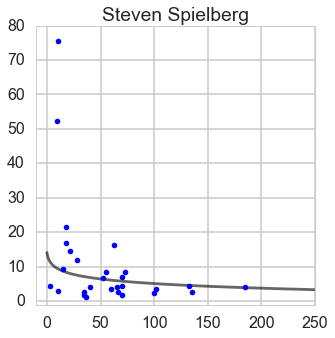
- The ratio cannot be negative, so we need to consider this when we choose function to fit data. When I fitted the ratio for Steven, I applied logorithm function.
Further works
- Scrape more directors and add some more features, like genre, producer and editor.
- The ideal final product should be a we page that you can input features then it will output the rank list of directors.
Detailed process
Scrape data from wiki
James Cameron
#https://en.wikipedia.org/wiki/James_Cameron_filmography
director = 'James_Cameron'
url = 'https://en.wikipedia.org/wiki/' + director + '_filmography'
#Apply this header to avoid being denied.
headers = {
    'user-Agent': 'Mozilla/5.0'
}
response = requests.get(url, headers = headers)
page = response.text
soup = BeautifulSoup(page, "lxml")
tables = soup.find_all('table')
#Check the tables visually and then get what we want.
tables = tables[0]

James_data = []
rows = tables.find_all('tr')
for row in rows[2:]:
    row_dict={}
    th = row.find('th')
    th_ref = th.find('a')
    if th_ref is not None:
        year = row.find('td')
        if year.findNextSibling().get_text() == 'Yes':   #Make sure he is the director
            row_dict['Title'] = th_ref.get_text()
            row_dict['Year'] = year.get_text()
            row_dict['url'] = th_ref['href']
            James_data.append(row_dict)
James_df = pd.DataFrame(James_data)
James_df.head(2)
| Title | Year | url | |
|---|---|---|---|
| 0 | Xenogenesis | 1978 | /wiki/Xenogenesis_(film) |
| 1 | Piranha II: The Spawning | 1981 | /wiki/Piranha_II:_The_Spawning |
Now we got the table which contains all movies that James direct and have a hyperlink so that we can find detailed information. Then I define a function to scrape budget and box office values based on this table.
def budget_boxOffice(director_movies):
    director_data = []
    header = ['Budget', 'Box_office']
    for i in range(director_movies.shape[0]):
        url_movie = 'https://en.wikipedia.org' + director_movies.url[i]
        headers = {
        'user-Agent': 'Mozilla/5.0'
        }
        row_dict={}
        response = requests.get(url_movie, headers = headers)
        page = response.text
        soup = BeautifulSoup(page, "lxml")
        tables = soup.find(class_ = 'infobox vevent')
        rows = tables.find_all('tr')
        if rows[-1].th.get_text() == 'Box office':
            row_dict['Box office'] = rows[-1].td.get_text()
            if rows[-2].th.get_text() != 'Budget':
                row_dict['Budget'] = None
            else:
                row_dict['Budget'] = rows[-2].td.get_text()
        else:
            row_dict['Box office'] = None
            row_dict['Budget'] = rows[-1].td.get_text()
        director_data.append(row_dict)
    df2 = pd.DataFrame(director_data)
    return df2
Apply this function and merge the result with original table.
James_df2 = budget_boxOffice(James_df)
James_df = James_df.merge(James_df2, left_index = True, right_index = True)
James_df = James_df.dropna(axis = 0)
James_df.head(2)
| Title | Year | url | Box office | Budget | |
|---|---|---|---|---|---|
| 2 | The Terminator | 1984 | /wiki/The_Terminator | $78.3 million[4] | $6.4 million[4] |
| 3 | Aliens | 1986 | /wiki/Aliens_(film) | $131.1–183.3 million[5][7] | $17–18 million[5][6] |
Then we need to define another function to clean this table.
def clean_num(bucks):
    bucks = bucks.replace(',', '')
    nums = re.findall('[0-9.]{2,}', bucks)   #find the number who has more than 2 digits
    if len(nums) == 0:
        nums = re.findall('[0-9.]+ [a-z]+', bucks)     #find the number + character combination
        if len(nums) == 0:
            return None
        else:
            nums = re.findall('\d', nums[0])
    mil = re.findall('million', bucks)
    bil = re.findall('billion', bucks)
    if len(mil) > 0:
        unit = 'million'
    elif len(bil) > 0:
        unit = 'billion'
    else:
        unit = 'digit'
    if unit == 'million':
        nums = [np.float(x) for x in nums]
    if unit == 'billion':
        nums = [np.float(x) * 1000 for x in nums]
    if unit == 'digit':
        nums = [np.float(x) / 1000000 for x in nums]
    res = np.mean(nums)
    return res

James_df['Box office'] = James_df['Box office'].apply(clean_num)
James_df['Budget'] = James_df['Budget'].apply(clean_num)
James_df.head(2)
| Title | Year | url | Box office | Budget | |
|---|---|---|---|---|---|
| 2 | The Terminator | 1984 | /wiki/The_Terminator | 78.300000 | 6.4 |
| 3 | Aliens | 1986 | /wiki/Aliens_(film) | 157.200000 | 17.5 |
Steven Spielberg
#https://en.wikipedia.org/wiki/James_Cameron_filmography
director = 'Steven_Spielberg'
url = 'https://en.wikipedia.org/wiki/' + director + '_filmography'
#Apply this header to avoid being denied.
headers = {
    'user-Agent': 'Mozilla/5.0'
}
response = requests.get(url, headers = headers)
page = response.text
soup = BeautifulSoup(page, "lxml")
tables = soup.find_all('table')
tables = tables[2]
For this table there are some years span over multiple movies, so we need to take care of this situation.
Steven_data = []
header = ['Title', 'Year', 'url']
rows = tables.find_all('tr')
for row in rows[1:]:
    row_dict={}
    td = row.find_all('td')
    td0 = td[0].get_text()
    check_td0 = re.findall('[0-9]{4,}' ,td0)    #Find number that has more than 3 digits
    if check_td0 != []:
        year = td[0].get_text()
        if (td[1].a is not None) and td[2].get_text() == 'Yes':
            row_dict['Title'] = td[1].get_text()
            row_dict['Year'] = year
            row_dict['url'] = td[1].a['href']
            Steven_data.append(row_dict)
    else:                                       #The first cell is not year so it has spanned year.
        if (td[0].a is not None) and td[1].get_text() == 'Yes':
            row_dict['Title'] = td[0].get_text()
            row_dict['Year'] = year
            row_dict['url'] = td[0].a['href']
            Steven_data.append(row_dict)

Steven_df = pd.DataFrame(Steven_data)
Steven_df.Year = pd.to_numeric(Steven_df.Year)
Steven_df = Steven_df[Steven_df.Year < 2016]    #We only want movies that have already been screened.
Steven_df.head(2)
| Title | Year | url | |
|---|---|---|---|
| 0 | Amblin’ | 1968 | /wiki/Amblin%27 |
| 1 | Duel | 1971 | /wiki/Duel_(1971_film) |
Scrape box office and budget values. Merge and clean table.
Steven_df2 = budget_boxOffice(Steven_df)
Steven_df = Steven_df.merge(Steven_df2, left_index = True, right_index = True)
Steven_df = Steven_df.dropna(axis = 0)
Steven_df['Box office'] = Steven_df['Box office'].apply(clean_num)
Steven_df['Budget'] = Steven_df['Budget'].apply(clean_num)
Steven_df.head(2)
| Title | Year | url | Box office | Budget | |
|---|---|---|---|---|---|
| 2 | The Sugarland Express | 1974 | /wiki/The_Sugarland_Express | 12.8 | 3 |
| 3 | Jaws | 1975 | /wiki/Jaws_(film) | 470.7 | 9 |
Save data sets.
James_df.to_csv('James.txt', index = False)
Steven_df.to_csv('Steven.txt', index = False)
Regression show time
Now I will apply the regression to find the fited line of box office vs. budget and rate of return vs. budget.
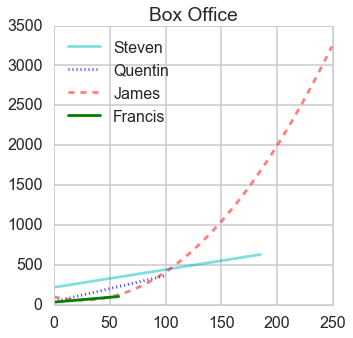
Box office vs. budget
Firstly, let’s plot all the points to visually check their relationship.
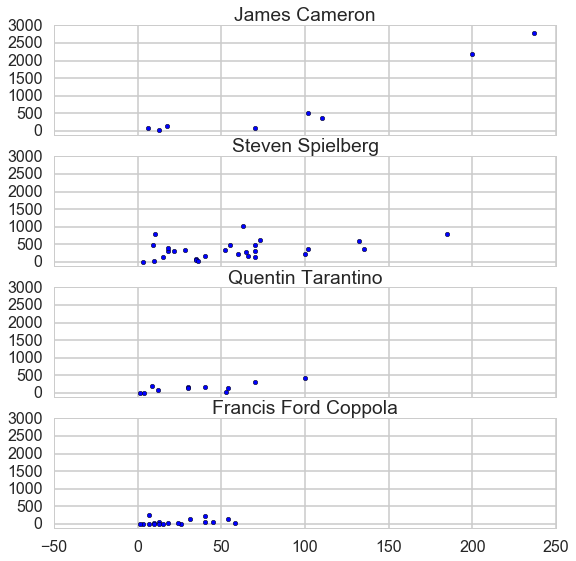
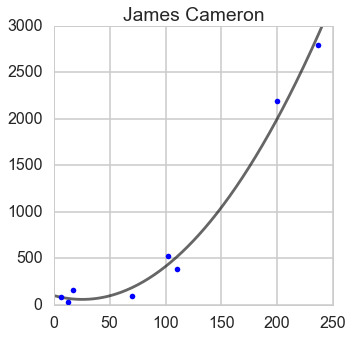
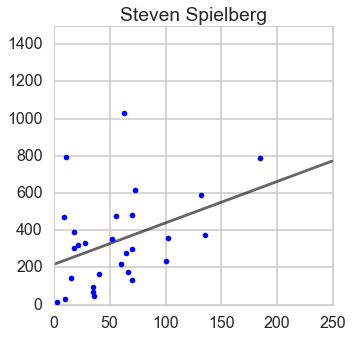
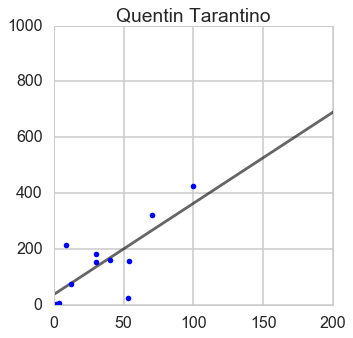
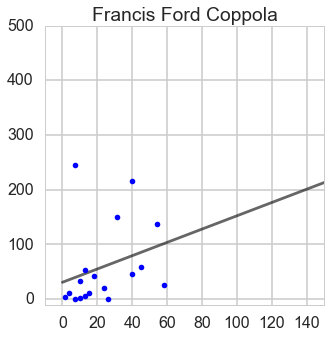
From this plot, we can guess James Cameron has a quadratic trend and the rest have linear trend.
James Cameron
lm = LinearRegression()
y_James = James_df['Box office']
X_James = James_df['Budget']
X_James = sm.add_constant(X_James)
X_James['Budget_sqr'] = X_James.Budget ** 2
lm.fit(X_James, y_James)
line_X = np.arange(0, 250)
line_X = sm.add_constant(line_X)
line_X = pd.DataFrame(line_X)
line_X['Budget_sqr'] = line_X.iloc[:, 1] ** 2
line_y = lm.predict(line_X)
plt.plot(line_X.iloc[:, 1], line_y, '-k', alpha = 0.6)
plt.plot(X_James.iloc[:, 1], y_James, '.b')
plt.title('James Cameron')
plt.xlim(0, 250)
plt.ylim(0, 3000)
fig = plt.gcf()
fig.set_size_inches(8, 8)
plt.show()
Steven Spielberg
lm = LinearRegression()
y_Steven = Steven_df['Box office']
X_Steven = Steven_df['Budget']
X_Steven = sm.add_constant(X_Steven)
lm.fit(X_Steven, y_Steven)
line_X = np.arange(0, 250)
line_X = sm.add_constant(line_X)
line_X = pd.DataFrame(line_X)
line_y = lm.predict(line_X)
plt.plot(line_X.iloc[:, 1], line_y, '-k', alpha = 0.6)
plt.plot(X_Steven.iloc[:, 1], y_Steven, '.b')
plt.title('Steven Spielberg')
plt.xlim(0, 250)
plt.ylim(0, 3000)
fig = plt.gcf()
fig.set_size_inches(8, 8)
plt.show()
Quentin Tarantino
lm = LinearRegression()
y_Quentin = Quentin_df['Box office']
X_Quentin = Quentin_df['Budget']
X_Quentin = sm.add_constant(X_Quentin)
lm.fit(X_Quentin, y_Quentin)
line_X = np.arange(0, 250)
line_X = sm.add_constant(line_X)
line_X = pd.DataFrame(line_X)
line_y = lm.predict(line_X)
plt.plot(line_X.iloc[:, 1], line_y, '-k', alpha = 0.6)
plt.plot(X_Quentin.iloc[:, 1], y_Quentin, '.b')
plt.title('Quentin Tarantino')
plt.xlim(0, 250)
plt.ylim(0, 3000)
fig = plt.gcf()
fig.set_size_inches(8, 8)
plt.show()
Francis_Ford_Coppola
lm = LinearRegression()
y_Francis = Francis_df['Box office']
X_Francis = Francis_df['Budget']
X_Francis = sm.add_constant(X_Francis)
lm.fit(X_Francis, y_Francis)
line_X = np.arange(0, 250)
line_X = sm.add_constant(line_X)
line_X = pd.DataFrame(line_X)
line_y = lm.predict(line_X)
plt.plot(line_X.iloc[:, 1], line_y, '-k', alpha = 0.6)
plt.plot(X_Francis.iloc[:, 1], y_Francis, '.b')
plt.title('Francis Ford Coppola')
plt.xlim(-10, 250)
plt.ylim(-10, 3000)
fig = plt.gcf()
fig.set_size_inches(8, 8)
plt.show()
The rate of return on investment vs. budget
Firstly, check scatter plot.
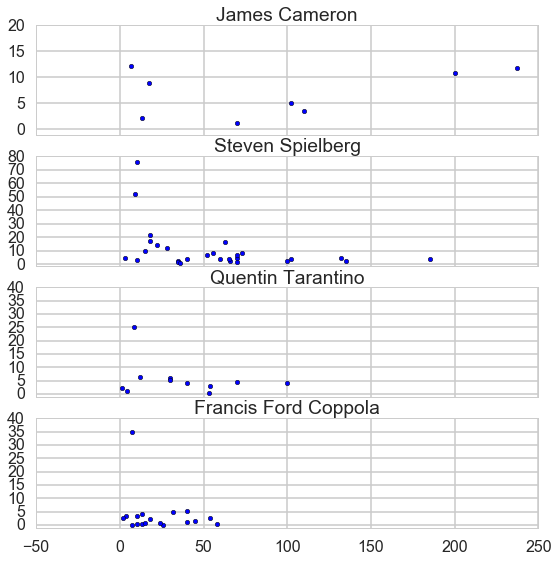
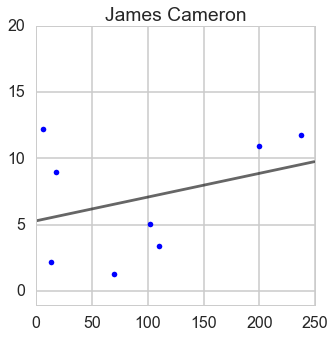
James Cameron
lm = LinearRegression()
y_James = James_df['Box office'] / James_df['Budget']
X_James = James_df['Budget']
X_James = sm.add_constant(X_James)
lm.fit(X_James, y_James)
line_X = np.arange(0, 250)
line_X = sm.add_constant(line_X)
line_X = pd.DataFrame(line_X)
line_y = lm.predict(line_X)
plt.plot(line_X.iloc[:, 1], line_y, '-k', alpha = 0.6)
plt.plot(X_James.iloc[:, 1], y_James, '.b')
plt.title('James Cameron')
plt.xlim(0, 250)
plt.ylim(-1, 20)
fig = plt.gcf()
fig.set_size_inches(8, 8)
plt.show()
Steven Spielberg
lm = LinearRegression()
y_Steven = Steven_df['Box office'] / Steven_df['Budget']
ind = y_Steven < 40
y_Steven = y_Steven[ind]
X_Steven = Steven_df['Budget']
X_Steven = X_Steven[ind]
X_Steven = sm.add_constant(X_Steven)
X_Steven['Budget_log'] = np.log(X_Steven.Budget + 1)
lm.fit(X_Steven[['const', 'Budget_log']], y_Steven)
line_X = np.arange(0, 250)
line_X = sm.add_constant(line_X)
line_X = pd.DataFrame(line_X)
line_X['Budget_log'] = np.log(line_X.iloc[:, 1] + 1)
line_y = lm.predict(line_X.iloc[:, [0,2]])
plt.plot(line_X.iloc[:, 1], line_y, '-k', alpha = 0.6)
plt.plot(Steven_df['Budget'], Steven_df['Box office'] / Steven_df['Budget'], '.b')
plt.title('Steven Spielberg')
plt.xlim(-10, 250)
plt.ylim(-1, 80)
fig = plt.gcf()
fig.set_size_inches(8, 8)
plt.show()
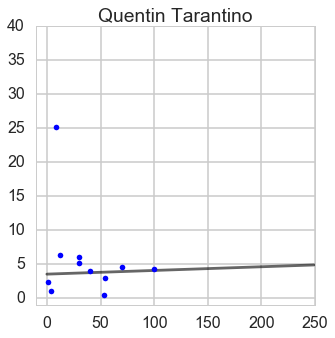
Quentin Tarantino
lm = LinearRegression()
y_Quentin = Quentin_df['Box office'] / Quentin_df['Budget']
ind = y_Quentin < 20
y_Quentin = y_Quentin[ind]
X_Quentin = Quentin_df['Budget']
X_Quentin = X_Quentin[ind]
X_Quentin = sm.add_constant(X_Quentin)
#X_Quentin['Budget_log'] = np.log(X_Quentin.Budget + 1)
#lm.fit(X_Quentin[['const', 'Budget_log']], y_Quentin)
lm.fit(X_Quentin, y_Quentin)
line_X = np.arange(0, 250)
line_X = sm.add_constant(line_X)
line_X = pd.DataFrame(line_X)
#line_X['Budget_log'] = np.log(line_X.iloc[:, 1] + 1)

line_y = lm.predict(line_X)
plt.plot(line_X.iloc[:, 1], line_y, '-k', alpha = 0.6)
plt.plot(Quentin_df['Budget'], Quentin_df['Box office'] / Quentin_df['Budget'], '.b')
plt.title('Quentin Tarantino')
plt.xlim(-10, 250)
plt.ylim(-1, 40)
fig = plt.gcf()
fig.set_size_inches(8, 8)
plt.show()
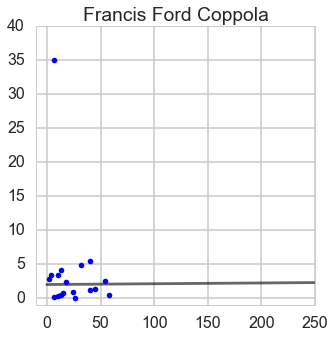
Francis Ford Coppola
lm = LinearRegression()
y_Francis = Francis_df['Box office'] / Francis_df['Budget']
ind = y_Francis < 30
y_Francis = y_Francis[ind]
X_Francis = Francis_df['Budget']
X_Francis = X_Francis[ind]
X_Francis = sm.add_constant(X_Francis)
#X_Francis['Budget_log'] = np.log(X_Francis.Budget + 1)
#lm.fit(X_Francis[['const', 'Budget_log']], y_Francis)
lm.fit(X_Francis, y_Francis)
line_X = np.arange(0, 250)
line_X = sm.add_constant(line_X)
line_X = pd.DataFrame(line_X)
#line_X['Budget_log'] = np.log(line_X.iloc[:, 1] + 1)
#line_y = lm.predict(line_X.iloc[:, [0,2]])
line_y = lm.predict(line_X)
plt.plot(line_X.iloc[:, 1], line_y, '-k', alpha = 0.6)
plt.plot(Francis_df['Budget'], Francis_df['Box office'] / Francis_df['Budget'], '.b')
plt.title('Francis Ford Coppola')
plt.xlim(-10, 250)
plt.ylim(-1, 40)
fig = plt.gcf()
fig.set_size_inches(8, 8)
plt.show()